Today I have been playing around trying to justify an observation that we made in my Calculus II class, which is as follows:
Observation 1.On a region where has consistent concavity, the error from the trapezoid sum is about twice the error of the midpoint sum, and has the opposite sign. (In fancy symbols: .)
It’s fairly easy to arrive at this observation by just doing a bunch of calculations. A fun activity for a Calculus II class is to reproduce Table 5.6.5 from Active Calculus; if you divide-and-conquer across a couple different groups, you can do this pretty easily in 15 minutes with appropriate use of technology. Then you just look at the column of errors, and say, gee whiz, Observation 1.
But then a student asked me why this is true. This was surprisingly tricky to run down. I scribbled about it for like three pages, most of which just ended up being, like, “let’s do some calculus now; by talos that was just geometry!!” I think I now have a reasonably convincing justification that I can at least handwave to the student in question, without too much additional technology. (Note that we are at the beginning of Calculus II, so in particular I don’t want to say the words “Taylor series” yet.)
Setup
Observation 2. To be more precise, the trapezoids in the trapezoid rule are trapezoids whose tops are secant lines to .
Observation 3. Midpoint rectangles are actually trapezoids whose tops are tangent to at the midpoint.
Proof by picture. This is Figure 5.6.3 from Active Calculus. For the sake of argument, I’m going to follow this figure throughout; notice that we can assume without loss of generality that the function is concave up. Say that the edges of the rectangles / trapezoids occur at and .
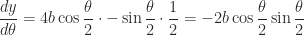
If you want a little more symbolic convincing, write down the equation for this tangent line: . Compute and observe that you get the area of the midpoint rectangle.
(Aside: Observation 3 would actually be true no matter what slope you picked for this diagonal line. It’s just convenient to pick the slope of the tangent line.)
Observation 4. The secant lines in question are damn near parallel to the tangent lines in question.
Justification. The slope of this secant line is . This is in fact the central difference approximation to the slope of the tangent line, .
Observation 5. Therefore, the secant line is pretty much just a vertical shift of the tangent line: if is the secant line and is the tangent line, then for some small constant . Specifically, would be a good choice; that’s the specific amount we’d need to scoot up by to get the left endpoints to match.
Idea of the proof
With this setup stuff established, I can now say the following, which will give you some idea of what we’re up to with the symbol-pushy stuff below. The idea is that since there’s such a nice relationship between the trapezoid-rule trapezoid and the midpoint-rule trapezoid (they only differ by a little parallelogram!), we probably have a nice relationship between their errors. Meditate upon the following picture (Figure 5.6.4) before proceeding. I’ll just point out that the height of the parallelogram is and the width is .
Nitty-gritty details
I’m noticing that we haven’t used our “consistent concavity” hypothesis yet. By “consistent concavity” we probably mean that is approximately constant on the big interval of which our little rectangle is a subinterval.
Observation 6. If has “consistent concavity,” then it’s approximately quadratic.
Proof. Suppose for some constant . Integrate twice and don’t forget your arbitrary constants:
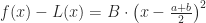
Okay, but which quadratic? We may as well ask for the linear part of to match the tangent line :
Soon we will learn the word “Taylor series” and this will seem more natural. For now, think of it as, we’re taking the linear approximation and sticking on some bendiness with a quadratic term . (The B stands for “bendiness.”)
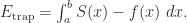
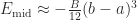
Observation 7. On this little subinterval, the error from the midpoint rule is .
(Note: that’s the that I’m going to talk about at the very end of this post.)
Algebra time: this is .
Notice, btw, that when the function is concave up, B is positive, so this value works out to be negative, which makes sense, because the midpoint rule should underestimate the true value.
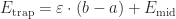
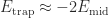
Observation 8. The error from the trapezoid rule is Using Observation 5, this is . Integrating a constant is easy, and the second integral is the one we just did in Observation 7. So we can conclude that .
(Looking back at the “idea of the proof” picture, is the area of the parallelogram you have to stack on top of the midpoint-rule trapezoid to get the trapezoid-rule trapezoid. So this makes sense: if you take the whole parallelogram and subtract the pink parts , you ought to get the red part . Why does it say + above instead of -, you ask? Good question: because is negative.)
Guess what: we’re back to where we started!
The prestige
Observation 1, re-stated: .
Proof. Let’s monkey around with this claim a bit. Since (by Observation 8) , this claim is equivalent to claiming that , or that . Then by Observation 7, , so the claim is that . I’m going to divide out a on both sides, and pull a 2 inside a parentheses, to arrive at:
Claim that’s equivalent to Observation 1:.
Why is this true, then? Well, what was anyway? That came from Observation 5, where we said that was the amount by which we’d need to shift up to get it to match , and we also said that it’s the amount by which the linear approximation undershoots the actual function.
What’s neat, though, is that we now know a little more about than we did before. Specifically, Observation 6 told us that .
Therefore, . Plug in : the LHS is and the RHS is exactly what we thought it should be.
The moral of the story
Let’s return to Figure 5.6.4 and we can tell a more interesting story now:
Zooming in on the tangent line and the blue curve : This last claim is basically saying that the amount by which the tangent line undershoots the function is controlled by (1) the bendiness of the function and (2) the width of the (sub)interval we’re looking at.
Notice also that the only reason this problem is interesting is that the blue line is curved. If it just went straight from the left corner to the middle and then straight from the middle to the right corner, then it’d cut the parallelogram into two equal pieces. Instead, because it bends down, there’s more red than pink.
Because the blue line is basically quadratic, it turns out that there’s basically half as much pink as there is red. If the function was allowed to wiggle as well as bend, then that ratio may not turn out to be so nice.
Specifically, the blue line cuts the trapezoid in such a way that the pink is 1/3 of the total. Where does that 3 come from? It comes precisely from integrating .
This is a post about the ongoing panicky doomsaying by professors in reaction to things like ChatGPT, Github Copilot, Wolfram|Alpha, Google Translate, and other forms of AI. The thesis of this post is that the panicky doomsaying reaction is a form of cop shit. As my audience tends to mostly be mathematicians, I’ll structure my argument in a comforting and familiar manner.
Cop shit is any pedagogical philosophy, technique, or technology that structures a learning situation into a game in which there is a perception of an adversarial relationship between students and instructors.
Example 1.2
Proctorio, Honorlock, and other remote proctoring systems structure exams as a game in which, according to the proctor’s perspective, the role of the student is to cheat and the role of the instructor is to prevent students from cheating. (Observation: remote proctoring systems are a modern panopticon. Less formal observation: this is cop shit to the max.)
Example 1.3
Letter grades structure a course into a game in which the role of the student is to achieve the maximum grade possible with the minimal amount of work, and the role of the instructor is to award the student the minimum grade that is supportable by evidence.
Example 1.4
Laptop policies structure each class session into a game in which the role of the student is to use their technology devices as much as possible, and the role of the instructor is to catch them using their technology devices inappropriately.
Theorem 1.5
Panicky doomsaying about ChatGPT and similar AI things is cop shit.
Proof. Our job in this proof is to identify a game that’s being played in which professors and students are on opposite sides. The argument is essentially that each assessment that an instructor is worried about being ChatGPT’d becomes such a game. An instructor perceives a threat: students can use AI to produce work that would trick the instructor into assigning a higher grade than would be merited by what the student can produce unaided. Therefore, the instructor assigns themselves the role of detecting and opposing such use, and gets panicky precisely because their task now seems impossible. More to the point of the proof: the instructor has now assigned themselves a role that’s adversarial to the role they are imagining for the student, which is to complete the assignment with minimal work. Thus we’ve satisfied the definition of cop shit, \qed.
So what should we do about this? How should this theorem make us think and act? I have some thoughts about that, but they’ll have to wait for the next blog post.
I was in a panel today at The Grading Conference (twitter @Grading4Growth) whose title was “Rethinking Assumptions.” We went mostly in the direction of assumptions about ungrading, so I wanted to write down a few other thoughts about assumptions about grading writ large.
This post was going to be a twitter thread but then I remembered that people like Robert Talbert are always telling me that most twitter threads should actually be blog posts.
Thesis statement: There are a lot of widely-held tacit beliefs that I think discourage many people from using alternative grading systems in their classes; fortunately, many of them are wrong.
You probably have more room to change things than you think
This is maybe the main hurdle I hear when I tell people about alternative grading systems. Many institutions have various policies that constrain instructors’ choices around assessment. For instance, virtually every university in the US requires instructors to post final letter grades at the end of the term. At some institutions, there’s a requirement to also provide midterm letter grades, and at others, there’s a policy that x% of the final grade must be based on a timed final exam. The constraints these policies impose are real and I’m not trying to say otherwise. I will suggest, though, that there’s room to operate within them. Ask yourself: what is actually required, and what requirements am I just inferring?
Asking such questions often reveals that nobody cares what you’re doing in your class on a day-to-day level. So even if there’s a requirement that you give a common final exam and grade it with points, that requirement doesn’t say anything about your weekly homework assignments, or your daily prep work, or your final project. You’re free to alternatively grade those however you like.
Asking such questions also often reveals spaces for creative insubordination. What if instead of writing a traditional final exam, you wrote down a bunch of learning objectives and then developed questions targeting each one, and then your final exam was just a stack of all of those problems stapled together, and you told students that they only have to answer the ones that they hadn’t already demonstrated their understanding of, and you graded each problem yes/no, and students could reattempt similar problems during the exam period if they didn’t get them right, and you then just reported the percentage of successfully-attempted objectives at the end? Congrats, you’ve fulfilled the policy, but you’ve just done standards-based grading inside it.
A key response to this challenge is academic freedom. This notion has been used in a variety of problematic ways by a variety of problematic people, but here’s a place where we get to use it for good. If we truly have academic freedom and that means that we have a say about what topics belong in our courses, then it must also mean that we have a say in how our courses are assessed, because assessment is a proper part of teaching and learning. Similarly, this is a place where people who hold tenure can use that power for good (for once).
As we leave this section I will note that being a white man makes it easier to find space for disruption or creative insubordination. People from marginalized groups are certainly going to have a harder time of this, and that’s a real constraint. But I think it’s still possible to make meaningful change within the structures that we must inhabit.
A tacit assumption that we make about the points in points-based grading systems is that they’re ratio data when they are at best ordinal. We like to make this assumption because it allows us to do math with our labels, but since it’s an incorrect assumption, such math is actually nonsensical.
The funny labels used in alternative grading systems I think often scare people away who are used to thinking about points. But as soon as we accept that points are just another kind of funny label, then it becomes much less scary to get rid of “10/10” and replace it with “Excellent”.
The grading system we have now is not natural
By “natural” here I mean in the sense of “natural law.” Points-based grading isn’t intrinsic or intensive to educational systems. It was not handed down to us upon tablets of stone. In fact, it’s a fairly recent development: it’s not really until about WW2 that the A-F system translated to the 4-point GPA scale becomes prevalent in the United States.
People who are thinking about adopting an alternative grading system often fret about various (good! important!) questions. “How do you determine the appropriate amount of work that corresponds to a final letter grade?” “How can I make sure I’m not biased against students from minoritized backgrounds?” “Shouldn’t we worry about how this system impacts students with jobs?”
The secret is that all of these questions are also applicable to points-based grading systems. We just don’t think so because points-based systems have become the unmarked category in which the answers to these questions are “obvious.” And in my opinion, points-based systems provide categorically worse answers to each such question.
Points-based systems are the result of a great many choices that were made by a great many people over a great many years. We get to interrogate those choices — and thinking about alternatives is an excellent way to do this.
You probably actually care about feedback loops
You probably don’t care about points, deep down. It’s easy to accidentally conflate the measurement of the thing with the thing itself, but I think deep down you know that the finger pointing to the moon is not the moon. What you care about is learning, and you probably know deep down that accrual of points is not the same thing.
Humans learn through feedback loops. I mean both of those words all the way down. What you care about when you are making marks on a student’s paper is the feedback that you are giving them: you want to help them see what went right and what went wrong, and find a pathway to improve. And what you’d really like is a loop: you’d love it if there were some reason for students to actually care about your feedback, take your suggestions into consideration, and demonstrate improvement (instead of just looking at a number at the top of a page and cramming said page back in their backpack forever).
If you’ve made it to the end of this post, maybe I have talked you into trying out some kind of alternative grading system in some way in your course. Here’s some tips for getting started.
A lot of people think that they have to jump in with both feet, and if you want to do that, then that’s legit. But if you want to stick a toe in first, that’s legit too. Try converting just one assignment to alternative grading. Maybe you’ll like it, and maybe you’ll see ways you can implement alternative grading in other parts of your course.
Various people have asked me recently about my mathematical autobiography assignment, about which I have previously tweeted, so I decided to put it on my blog here for easier reference.
Caveats: This idea is not original to me (but I don’t remember who I heard about it from first). I originally wrote my own autobiography maybe two years ago now, and I think it could stand an update.
Those things said, I really enjoy the responses I get on this thing. It’s really remarkable how much people are willing to share with me, and how much it helps me quickly build rapport with my students. It allows me to deeply understand who they are when they come into a math classroom — a complicated space for many people!
But most importantly, I think, it helps signal to my students that there’s going to be something different about this space. One student wrote me a thank-you card at the end of the term one year, in which they said something like — and you’ll forgive my inability to quote directly because the card’s in my office — “From the very first assignment I knew that this class would be different, that it was okay for me to be myself here, and I’ve never felt that in any other math class.” This sounds uncomfortably like I am tooting my own horn, but like, honk honk, this assignment can be incredibly valuable to you and your students, especially those who come to your classroom from various minoritized backgrounds. You can have these kinds of amazing experiences and connections too, if you want.
Okay, so with no further ado, here’s the instructions I put on Canvas:
Your first assignment in this course is to write a short mathematical autobiography. Here’s mine, as a sample: [link to a Canvas page]
The purpose of this assignment is to have you reflect on your experiences with mathematics. This will set the stage for all the (possibly different) ways you will experience mathematics in this class. The autobiography will also help me know how you feel about mathematics, understand where you’re coming from when you come to a math class, and create a course that will be useful for you.
Describe your history as a learner of mathematics. You might include things like: some experiences with teachers (in any grade), good and bad teachers and what made them good or bad, how your attitude toward mathematics has changed over the years, why you like it or don’t like it, what feels good about doing math or learning math or teaching math, what makes you nervous, what is exciting for you, what you’re looking forward to …
As far as length: if you’re only writing two or three paragraphs, there’s more for you to think about; if you’re writing three pages, you’re overthinking it.
And here’s my own mathematical autobiography that I provide as an example:
I’ll start my story at the beginning of my undergraduate education. I started at Salt Lake Community College as a physics major — I’ve always liked the ability of physics to answer fundamental questions about how the world works. However, I came to realize that it wasn’t really the physics I liked, but instead, the language that the physics was spoken in. I realized that fundamentally, I liked math.
An important component of this realization was Cindy Soderstrom, an excellent math teacher at SLCC. She had a way of making math concepts visible in everyday contexts, or of inventing contexts for abstract math concepts (an asymptote is just an electric cow fence). What’s more, she was excited about math, and about teaching math, and her enjoyment was contagious. I found myself wanting to teach math the same way, because of all the prior experiences I’d had with math teachers who were less enjoyable, less fun, and less interesting.
My first actual experience teaching math came as a one-on-one tutor at the University of Utah. I discovered that I’m good at diagnosing what people aren’t understanding, and at figuring out how to help them figure it out. I continued working as a tutor in the tutoring lab at the U and enjoyed helping lots of people figure out and enjoy mathematics.
Usually when you do a master’s degree and you’re going on to do a Ph.D., you have to pick a certain field of mathematics to specialize in. This was really hard for me! I didn’t want to spend my whole career shut up in an office just proving a bunch of theorems about a really specific thing — what I really liked was teaching, and what I really wanted to spend my time thinking about was how to teach better. I was complaining about my dilemma to a colleague, and he told me that there was actually such a thing as Ph.D. programs in math education. This was kind of a dream come true!
I ended up at San Diego State University, where I learned a lot about how people learn things in general and how people learn mathematics in particular. I had lots of interesting experiences studying how people thought about things they were learning, read lots of interesting articles about other researchers’ experiences, and got to teach students math in lots of interesting contexts (including a 200-person lecture, which was wild).
Most importantly, I learned that there’s no such thing as not a math person — I saw people who never believed they could do well in a math class change their minds and learn a lot of stuff. It’s certainly true that there are people for whom math naturally comes a little easier, but that’s true of everything — drawing, singing, driving, cooking, writing, picking clothes that match, etc. etc. All of these skills are things people can develop with practice, effort, time, and help.
After I graduated from SDSU, I started teaching at the University of Northern Colorado in Greeley, where I continued to develop and refine my teaching style and learn new and interesting things about how people learn mathematics. I came to Westminster last year because I’ve known for a long time that it’s a place where great teaching happens, and I’m so excited to continue to learn how to teach math better.
Hope that helps; please let me know if you have any questions!
It’s probably been said, and if not then I’m saying it right here, that differential equations is the systematic study of dirty tricks. Here’s a good one I encountered in the 1924 monograph on the calculus of variations that I’m rendering into an online PreTeXt book.
For various reasons, we’re looking at the differential equation
,
where is a constant. This equation is separable, but if you separate, you get
,
which I don’t see a great way to integrate. This means it’s probably
Time for a dirty trick
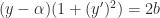
The thing that was annoying to me in that integral is the square root, which came about because I decided to isolate . So I wonder what would happen if I solved for instead:
Well now we’re getting somewhere. If I’m in a calculus headspace and I see anything that remotely resembles in a denominator, I immediately want to make the trigonometric substitution . So, what the hell, let’s just say and see what happens.
I’m liking this outcome for a couple of reasons:
The derivative has gone away!!
No more annoying fraction!!
I’ve got a pretty reasonable thing for !! It’s in terms of instead of , but worse things have happened.
And actually, that gives me another good idea: maybe I’ll temporarily abandon my goal of writing down an explicit function in favor of writing down parametric equations for my solution curve.
In service of that new goal, where is , anyway? The only place is occurring is hidden away in , which really means . Since I made that substitution , that really means . By the inverse function theorem, this is the same as . That’s nice, but I really need to know if I’m gonna recover a function .
But hey, I already know , and I also know , so I could easily figure out — it’s just . So now I can abuse the chain rule:
That’s easy enough to integrate using the power-reducing identity.
Getting a little dirtier
Do you know, that thing I just got for looks a lot like the thing I got for — I’m just off by a factor of -2. I wonder if I pick, for my original dirty trick, instead of just ?
Nice, so now that we made our trick just a little dirtier, we’ve now got something that looks really symmetric, and integrating is at least no more difficult than it was before.
In case it’s helpful for other people, here’s the announcement I just sent out to my classes through Canvas. Your course setup is probably different from mine, but I think it may be helpful to see examples of how other professors are communicating with students. Some of my classes have slightly different structures, so I’ve tried to indicate the ways I changed the announcement between those courses.
Hi all,
So as I’m sure you’ve heard by now, Westminster College is canceling all face-to-face classes through the end of the month. This is the right decision; we all need to work together to flatten the curve and prevent the medical crisis from getting real, real bad. A big part of that is limiting the amount of face-to-face contact we have with each other, because that’s how viruses spread, so let’s just not meet in person, yeah? Also, wash your hands. 🙂
Here is Westminster’s timeline, as I understand it:
Week
What’s happening
March 9-13
Spring break
March 16-20
Classes are cancelled (extended spring break)
March 23-27
Classes are held online
March 30 – April 3
Maybe back in person? We’ll see!
So what does all this look like for our class? I don’t have complete answers to that question, and I’m going to be taking the next few days to figure out better answers. However, I promise that I will do my absolute best to provide you with a good and worthwhile course. I also just have to admit, in the interest of transparency, that there’s just no way the course experience will be the same as it would have been — but like, that’s okay! It’s going to be what it’s going to be, and that’s all it can be.
Here’s some stuff that I have figured out so far, and some things that I’m going to be thinking about more in the days to come.
Content coverage
I super don’t know if we’re going to have time to “cover” (whatever that means) all the stuff I was originally planning to. Expect the list of learning targets to change a little bit because of the time constraints on the course. We’ll need to play this by ear throughout the rest of the term.
Existing assignments
Fortunately I think our existing assignment structure — Problem Sets and (Webwork sets / R modules) — will continue to work pretty well. We’re handing in all of these things in online anyway, so yay, no big disruption here.
Deadlines
For the rest of the semester, I’m offering unlimited extensions on all deadlines. Essentially, everybody gets unlimited free tokens, (and I’m going to make it so Webwork sets will remain open indefinitely). I will continue to put due dates on Canvas assignments, because they will help you stay on track. Please don’t ignore deadlines, but know that they are flexible.
Here’s what you definitely shouldn’t do: Definitely don’t wait until the end of the term to do all the work for the course. You will hate your life, you won’t learn very much, and I’ll be pissed that I have to grade everything all at once. 🙂
Quizzes
I don’t know that a daily exit quiz makes sense anymore, and we’re definitely losing a couple of days anyway. I’m thus removing quizzes from the final grade calculation table. I don’t want you to stop doing quizzes! They’re still useful! I’m going to think about ways I can align quizzes with sections instead of days, because I think that makes more sense in our new situation, but you’ll be on the honor system for completing them.
Drop-in hours
I’m going to move drop-in hours online, clearly. I’m exploring a couple of different platforms, including Zoom, Twitch, and Discord, and I’ll let you know what I find out about which one works best. Plan on the current drop-in hours schedule, but since there’s significantly less constraints on our scheduled time, maybe we can schedule some new times that offer some more flexibility (evenings?). We can also continue to use the youcanbookme system to make appointments for other times to meet virtually.
Project changes
(For my classes with creative projects:) I think that the extra week we’re not meeting might change your creative project plans. Please feel free to modify your proposal if that’s the case.
(For my statistics class:) I’m certainly not going to ask you to collect data for your project this semester. Instead, you should plan on locating some existing data, either in one of the libraries in R or somewhere on the internet or whatever. Please feel free to email me if you’d like some help locating interesting data and planning your analyses. More on this the week of the 23rd when we come back together. 🙂
Changes to the syllabus
Clearly all of this is going to cause a bunch of changes to the syllabus. I’ll be updating the google doc; watch for changes to be indicated in different-color text.
What you should do next week
Per instructions from the provost, we won’t be holding any formal meetings of class. I’m going to invite you to a super low-key, super informal meeting at our usual class time on Monday. It’ll be through Zoom or Twitch or Discord or something like this. I’m not taking attendance; this is just an opportunity for you to see some familiar faces and ask some questions. No math will happen (unless you have interesting math questions) and you do not need to attend if you can’t.
I’m also going to extend a few deadlines, and I’m going to sit down and grade a ton of stuff. That will probably prompt a ton of rewrites. Take this upcoming week and knock all of those out, so that you’re ready for new stuff starting on March 24.
Thank you
Thank you, thank you, thank you, in advance, for your patience and flexibility as we figure all of this out together. I’ll be in touch with more details as I figure them out.
Let’s all trust each other that we’re going to do as good of a job as we possibly can in the circumstances. Let’s take care of each other, and care for each other, even though we’re at a distance. This is cheesy, but let’s hold each other in our hearts. We don’t have to be in person with each other to do that. We don’t have to be in person with each other to learn.
Pretty much, if the cross product is to have any of the properties we’d like it to have, then we’re forced to conclude that the cross product of parallel vectors must be zero.
Reason #1: The cross product is perpendicular to both of its inputs
Two vectors form a plane. Every plane has just one direction that’s perpendicular to it. We want the cross product to point in that direction.
“But wait,” you may be saying, “if the two vectors are parallel, then they don’t form a plane, they just form a line.” Yep, exactly. So now there’s a bunch of different directions that are perpendicular, so that means that the direction of the cross product is suddenly not well-defined, yikes.
Math’s favorite thing to do when something is not well-defined is to cop out and give a weird answer that’s vacuously true. I’m supposed to point in a bunch of directions at once? Ha-ha, math says, I can’t do that, so instead I’m going to point in no direction at all!!
Reason #2: The cross product is anticommutative (because of the right-hand rule)
The cross product is supposed to follow the right-hand rule, but that ends up meaning it has to be anticommutative. (Point your first finger along i and your second finger along j. Where’s your thumb pointing? Now point your first finger along j and your second finger along i. Now where’s your thumb pointing?)
Ok, so, we’re forced to admit that u x v = -(v x u). Well, what if we replace u with v, to find out what we’d get if we crossed any vector with itself? Then we’re in a funny situation: v x v = -(v x v). That is, whatever v x v is, it has to be the same as its own negative — it can’t change if you reverse it. The only vector that doesn’t change if you reverse it is 0.
Reason #3: The magnitude of the cross product is the area of a parallelogram
So far our reasons have been about direction. There’s also a good reason that comes from thinking about magnitude.
Two vectors form a parallelogram. (Make a copy of the first vector and stick its tail on the tip of the second. Then do the vice-versa thing to the second vector. Voila, a parallelogram.)
Vectors need both a direction and a magnitude. I think a pretty reasonable thing to say is the magnitude of the cross product is the area of that parallelogram.
“But wait,” you may be saying, “if two vectors are parallel, then they don’t form a parallelogram.” You’re kinda right. Parallel vectors do form a parallelogram, but it’s a degenerate parallelogram: a real boring parallelogram that looks like the result of a regular parallelogram being fed into a hydraulic press. Guess what’s the area of this degenerate parallelogram? You’re right it’s zero yay
I’m up for contract review this year, and I’m also eligible for promotion, so I just completed my teaching narrative. I got real self-indulgent on this thing and ended up writing almost 3500 words (yikes; sorry, committee). There’s one section in particular that I thought would be useful to share.
In July I participated in an AIBL workshop and just enjoyed the hell out of it. Even though I’ve been an active learning devotee for most of my career, and thus have been practicing “big-tent IBL” for a number of years, I learned a ton and developed my confidence to go with a full-on, notes-only, student-presentation style analysis course this semester. I really can’t recommend AIBL workshops enough.
One thing that particularly resonated with me was how the workshop facilitators framed IBL in terms of the presence and interaction of four pillars. As soon as I heard them, I knew that they were going to be a really useful way to explain my teaching philosophy (indeed, I have come to think of them as the axioms for my approach to teaching); as soon as I started writing, a lot of my attitudes and heuristics fell neatly into the framework. Maybe this will spark some similar thoughts for you in your own teaching practice and philosophy.
Students engage deeply with coherent and meaningful mathematical tasks.
There’s a lot to unpack here. First, in a math class, we need to be learning math, so our tasks must be mathematical. What tasks “count” as mathematical? That is, what tasks honestly reflect the actual practice of working mathematicians? What tasks help students develop honestly mathematical habits of mind? My answers to these questions are always evolving, but in general, I try to focus on understanding over memorization, and on concepts rather than procedures. If there is a computation, I ask students what it means when they’re done.
Tasks must be rich enough to support deep engagement. This is another reason why I deemphasize tasks whose sole purpose is computation: a student can turn off their brain when doing such tasks, and therefore they’re not engaging deeply with mathematics while doing it.
Tasks must also hold together coherently across multiple time scales. I try to help students see the connections between tasks they work on during one class session, or on one homework set. I also try to help students see the connections between tasks from September and December. This means that I have to create tasks that honestly support making such connections. One of the most wonderful things about mathematics is how deeply interconnected it is; designing tasks that help students see those connections is a way I can show them the wonder of a subject that sometimes looks quite dry from the outside.
Students collaboratively process mathematical ideas.
This is not just a logistical statement about what happens in class on a given day; it is a statement about the general process of learning. To me, this means that if I am not providing time in class on a given day for students to collaboratively process mathematical ideas, then I am not providing them time to learn.
Four students can be sitting at the same table working on the same task at the same time without collaborating. So, tasks must be groupworthy; the physical space must support collaboration; and I have to help students learn to work together as equals.
I like that this statement is agnostic as to the source of mathematical ideas. It’s okay for me to introduce an idea I want students to think about — as long as I then give them room to process it collaboratively. Excellent teaching means moving responsively along a continuum between telling and discovery.
This pillar implies a particular kind of caring and openness in the community of the classroom. Ideas are valued and examined, no matter what: whether an idea comes from a student or an instructor, whether it’s complete or a rough draft, whether it’s ultimately correct or incorrect, we work together to process it and learn from it. I work hard with students to negotiate norms and expectations that foster this kind of classroom community.
Instructors inquire into student thinking.
First of all, this is my favorite part of my job.
This is also a key part of my job. If I’m out to help students improve their understanding of mathematics, then I must diagnose their current understanding. So, if I am not providing room in class for students to express their thinking, then I have no hope of understanding it, let alone of helping them improve it.
Inquiring into student thinking helps students sharpen their thinking. Making students explain their thinking to me (and to other students) helps them see what they understand, solidify their understanding, and identify the precise things they’re still having trouble with.
This pillar helps inform my assessment philosophy: Assessment isn’t about giving points, it’s about understanding student thinking. So, I approach students’ work in the same way that I approach a conversation with that student: as an opportunity to understand their thinking and to help them sharpen it.
Instructors foster equity in their design and facilitation choices.
I need to design equitable course experiences. For instance, I use open educational resources (OERs) whenever I possibly can, to help lessen the financial burden of education; I incorporate universal design principles to allow students multiple opportunities and multiple pathways to develop and demonstrate competence; and I carefully craft syllabi that are understandable and navigable.
I need to facilitate equitable course experiences in the moment. For instance, I help students (especially those from minoritized backgrounds) develop their mathematical identity and power by assigning competence (another reason to inquire into student thinking!); I work with groups to ensure that every student’s voice is heard; and I work seriously with campus disability resource centers to modify courses in order to support students with disabilities.
I need to know what equity means in the first place. (Gutierrez’s framework has been influential on my thinking so far.) I need to interrogate and address my own unconscious biases. I need to explore ways to dismantle oppressive systems, even when they are ones that have benefitted me.
I’m a proud gay man, and I’m out in the classroom, because I want to help LGBTQ+ students see that there are people like them who have fulfilling professional lives. I didn’t see many people like me when I was in college; more visibility of this sort would have been a great boon to me during my college years.
I’ve given a few examples of things that are currently in my toolbox, but it’s extremely important to me to continue to learn new ways to recognize and address inequity in my classroom.
It’s Friday afternoon, I’m pretty much caught up with grading, nothing is pressing, so it seems like a good time for a moderately self-indulgent blog post. I had a really good day in the classroom yesterday — no, you know what, scratch that, I felt like I kicked ass — and I think it might be useful for me to recap what happened and reflect on why I felt so good about stuff.
The context
I’m currently teaching a summer semester DATA 220. This is our version of your usual intro-level service stats course that’s required by whatever departments across the university. Ours is taught using a nice set of R modules designed for RStudio to handle computations, which frees us up to talk more in class about using your human brain for the process of meaningful inference. Our summer semester is 8 weeks long as opposed to the usual 15 or 16, which means that the course is highly compressed, even though we meet in three-hour blocks rather than the usual two-hour blocks. I’ve got 12 students enrolled in the course, approximately 10 of which are going to show up on any given day. I also have a colleague sitting in on the course just to learn some statistics. Students sit at hexagon tables in groups of two or three, and there’s three big whiteboards at the back of the room that I mostly use as student space.
The plan
The topic for yesterday’s class was t-tests of two means — both paired means and independent means. My plan was to focus on how to decide whether data are paired or independent, then look at an example that would allow us to discuss checking conditions and interpreting a confidence interval. This is pretty representative of the kinds of things I like to spend time on: human brain stuff that you need to think about before interacting with a computer.
Part 1: A student question
At the beginning of class I asked if people had any questions from previous classes. The main question that emerged was in relation to a recent assignment I gave them about interpreting confidence intervals. In particular I asked them, when we say “we’re 95% confident that the true population whatever is between blah and blah”, what do we really mean? Percentages are always of something, so 95% of what? This is a hard question, even for like actual scientists (see 12), and the right answer is quite technical*, so students always struggle with this. One of the R modules I linked above contains a pretty nice discussion of the issue — in particular, it gives examples of three or four common misinterpretations of the confidence interval — so I told students to be sure to read that when they were composing their answers.
So, a student asked about this part of the assignment, and this question launched us into a long, profitable discussion about confidence intervals. I decided to bring in another one of the problems on the assignment, which I’ll just screencap here:
We read through the discussion in the R module together, and then I asked students to illustrate the misinterpretations in the R module by seeing which of the statements in Exercise 3.6 was similar. (The statements labeled (a) and (c) are incorrect for reasons discussed in the module.) This went really well, and it showed students how useful the discussion at the end of the R module actually was — by necessity, it’s quite a technical discussion, and I think a lot of people read it with their eyes glazed over before we dove into it together in class.
I then called back to another exercise on this assignment: “A survey found that 52% of U.S. Twitter users get at least some of their news from Twitter, with a confidence interval from 45.8% to 58.2%. Does this survey give statistically significant evidence that more than half of U.S. Twitter users get some news from Twitter?” This is an example of a very common way that people will lie with statistics, either intentionally or unintentionally: they’ll report a point estimate without acknowledging a margin of error. I asked students to do a one-minute paper (one of my favorite little active learning techniques!) writing a better sentence reporting the result of this survey: still understandable to a layperson, but more statistically responsible. We then combined ideas to make a good sentence that the whole class agreed on. I don’t remember exactly what we came up with, but something like, “Probably somewhere between 45% and 58% of U.S. Twitter users get some of their news from Twitter.” I do remember that they insisted on the “probably.”
This whole discussion was so great. I really enjoy the affordance that the three-hour block gives me to dig deep into things I didn’t necessarily plan to do. We got to talk about the extremely relevant issue of people lying with statistics, I got to insist on precision in language, we saw the relevance of class resources, we built connections between various problems on an assignment, and we left with everybody feeling more solid in their understanding of confidence intervals. (Also, I felt pretty secure in my own content understanding; this has not been a given in previous statistics classes since I’d never actually taken one before I started teaching them. 🙂 )
Part 2: Paired vs. not-paired activity
So next we moved into the planned portion of class. Before class, I’d given the students some reading from the book about paired vs. independent samples. However, I follow our textbook in hating the term “independent samples” because of the immediate conflation with “independent” as in “not associated,” so I called them “paired” and “not-paired” data. In the reading quiz (on Canvas and due one hour before class), I asked students to take a stab at defining paired vs. not-paired data, and give examples of both.
The first thing we did in this segment of class was another one-minute paper where I had them recall in a sentence or two their answers to the reading quiz, and then compare their sentences with the other people sitting at their table. After they’d had some time to discuss, we talked as a whole class about this, and got some words out, including “correspondence” and “groups,” that would be useful later. I told them that my point with this activity was that it’s hard to give a definition in words, and I wanted to introduce another tool, which is to look at the shape of the dataframe:
Paired and not-paired data frames. Tables from ISRS.
Looking at the dataframe, it’s much easier to see the difference: in paired data, each case has values of two numerical variables; in not-paired data, each case just has one numerical variable (that we’re interested in), but the cases fall into two groups.
I then rehashed an activity I’d used in a previous semester: I asked each group to pick their favorite examples of paired and not-paired data someone came up with on the reading quiz, draw a dataframe for their example on one of the back boards, and use their drawing to explain why the data are paired vs. not-paired. This was a fun activity. People got super into it. There was a lot of argument within each group about what the variables should be called and what each case was (which was exactly my point: in order to decide whether the data is paired or not paired, you need to think hard about what a case is, and what the variables are). Eventually, each of the three groups had a couple of dataframes drawn up.
At this point, I suddenly thought about an activity I’d done in a different course: a mini poster session. Kinda making this up on the fly, I told students that someone from each group besides the person who had the marker while drawing the dataframes had to stay and be the presenter, and then the other members of the group would go and visit the other groups. Not to toot my own horn too much here, but honk honk, this was awesome. I was really happy with how this activity forced everyone in the group to be accountable for the group’s work. As soon as I described what was happening, I saw a couple of students who had previously been less-involved get nominated to be the presenters, and then start asking their groupmates really seriously about how to explain their examples.
After the poster session, I had them look at an exercise that’s going to be on this week’s homework:
I assigned each group to one of these three scenarios. The group chat went pretty quick, but the class discussion afterwards was really interesting: group (a) talked about how, depending on how you interpret the sentence, their scenario could be either paired or not-paired. This made me so happy to see that my students were comfortable with ambiguity and weren’t pushing for “but what’s the riiight answer???”.
Part 3: Sheep heart attacks example
The next thing on our docket was an example: data from an experiment testing the use of an embryonic stem cell treatment on 18 sheep that had a heart attack. (I didn’t previously know that sheep could have heart attacks, but I guess they have hearts, so sure, why not.) We had a quick discussion about whether the data would be paired or not-paired, and then moved into checking conditions for using the t-test.
One of the conditions as we’ve set them up is to ensure that the sample is less than 10% of the population. (This is part of checking independence of observations.) At this point a student said, “I’m not sure about this one, because, what’s the population? Is it just sheep in this farm, or what?”
I love this question because it is absolutely a human brain question. This is absolutely the kind of question I want my students asking. This question opened a door for us to have a really good discussion about the relationship between sample and population: what do you, with your human brain, think is a reasonable broader population for your particular sample to generalize to? We threw out a bunch of ideas (sheep in this barn, sheep on this farm, sheep in this city, sheep in this state, sheep in the US, sheep in the entire world, whatever particular breed of sheep, etc. etc.), and then I had them rate how comfortable they felt generalizing our sample of 18 sheep to these various different populations. I concluded this bit by saying, my point is that there is no right answer to this question (to which a student said, “Well, why didn’t you just say that at the beginning?!”) — there is only a right thought process.
We wrapped up this example by looking at a confidence interval (that I got from RStudio and am not particularly interested in the computational details, thanks) and using it to answer our important real-world question: did the treatment work?
So much great stuff happened in this segment. A student felt comfortable asking a great question that spurred us into an important discussion about a human brain part of statistics. We were able to tie back to previous understandings of confidence intervals. Students made good real-world conclusions and backed them up with meaningful statistical evidence.
Part 4: Work time
We finished up with some time for students to work on their term group projects. I wandered around and helped answer questions that came up. This was also super fun. Everybody was very engaged in their own little world of personally-interesting data. Even when class time was officially up, and I packed up to go home, two students were still working together on an interesting thing they’d found. Nothing warms my grubby little soul more than students getting really interested in something and ignoring the time. 🙂
Some umbrella thoughts
Beyond all the individual blow-by-blow reasons, I had some sort of overarching thoughts while reflecting on why I felt like this class went so well. Really, they boil down to that I felt capable. Because I now have a good toolbox of active learning techniques that I’ve developed over the last few years, I was able to deploy interesting activities at useful times. I remixed some old stuff and threw in some new stuff and improvised like crazy. Also, because this is now the third time I’ve taught DATA 220, I feel pretty solid in my content knowledge, even for tricky technical points. I feel like I have a reasonable handle (that will only get better) on what things students will find confusing, and on what the high-leverage ideas are for breaking confusion. What’s more, I now have a depth of experience that allows me to identify that a class went super well, and the reflective tools to think critically about why.
Ultimately, I’m writing this blog post to a future myself, because I know there’s going to be a future day where I feel way less capable than I did about this class session, and this will be a good reminder for me:
Some days, I really love my job. 🙂
* Were we to take a whole bunch of random samples, and correctly construct a 95% confidence interval from each one, then we could expect approximately 95% of those confidence intervals to capture the true population parameter. (See, that’s tricky.)


![[a, b]](https://s0.wp.com/latex.php?latex=%5Ba%2C+b%5D&bg=ffffff&fg=222222&s=0&c=20201002)


![f(x) \approx \underbrace{\left[f\left(\tfrac{a+b}{2}\right) + f'\left(\tfrac{a+b}{2}\right)\left(x-\tfrac{a+b}{2}\right)\right]}_{L(x)} + B \cdot \left(x-\tfrac{a+b}{2}\right)^2](https://s0.wp.com/latex.php?latex=f%28x%29+%5Capprox+%5Cunderbrace%7B%5Cleft%5Bf%5Cleft%28%5Ctfrac%7Ba%2Bb%7D%7B2%7D%5Cright%29+%2B+f%27%5Cleft%28%5Ctfrac%7Ba%2Bb%7D%7B2%7D%5Cright%29%5Cleft%28x-%5Ctfrac%7Ba%2Bb%7D%7B2%7D%5Cright%29%5Cright%5D%7D_%7BL%28x%29%7D+%2B+B+%5Ccdot+%5Cleft%28x-%5Ctfrac%7Ba%2Bb%7D%7B2%7D%5Cright%29%5E2&bg=ffffff&fg=222222&s=0&c=20201002)


.
 ,
,  is a constant. This equation is separable, but if you separate, you get
 ,
, . So I wonder what would happen if I solved for
  instead:
 in a denominator, I immediately want to make the trigonometric substitution
  . So, what the hell, let’s just say
  and see what happens.
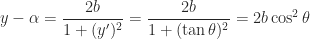
 instead of
  , but worse things have happened.
 in favor of writing down parametric equations
  for my solution curve.
 . Since I made that substitution
  . By the inverse function theorem, this is the same as
  . That’s nice, but I really need to know
  if I’m gonna recover a function
  .
. , and I also know
  , so I could easily figure out
  — it’s just
  . So now I can abuse the chain rule:
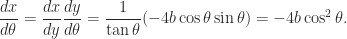
 — I’m just off by a factor of -2. I wonder if I pick, for my original dirty trick,
  instead of just
  ?
?